Practice System Design by actually testing your architecture.
Sketch boxes and arrows on a clean whiteboard, explain how your system works in plain English, and run a 60-second traffic simulation for instant feedback across 110 interview questions.
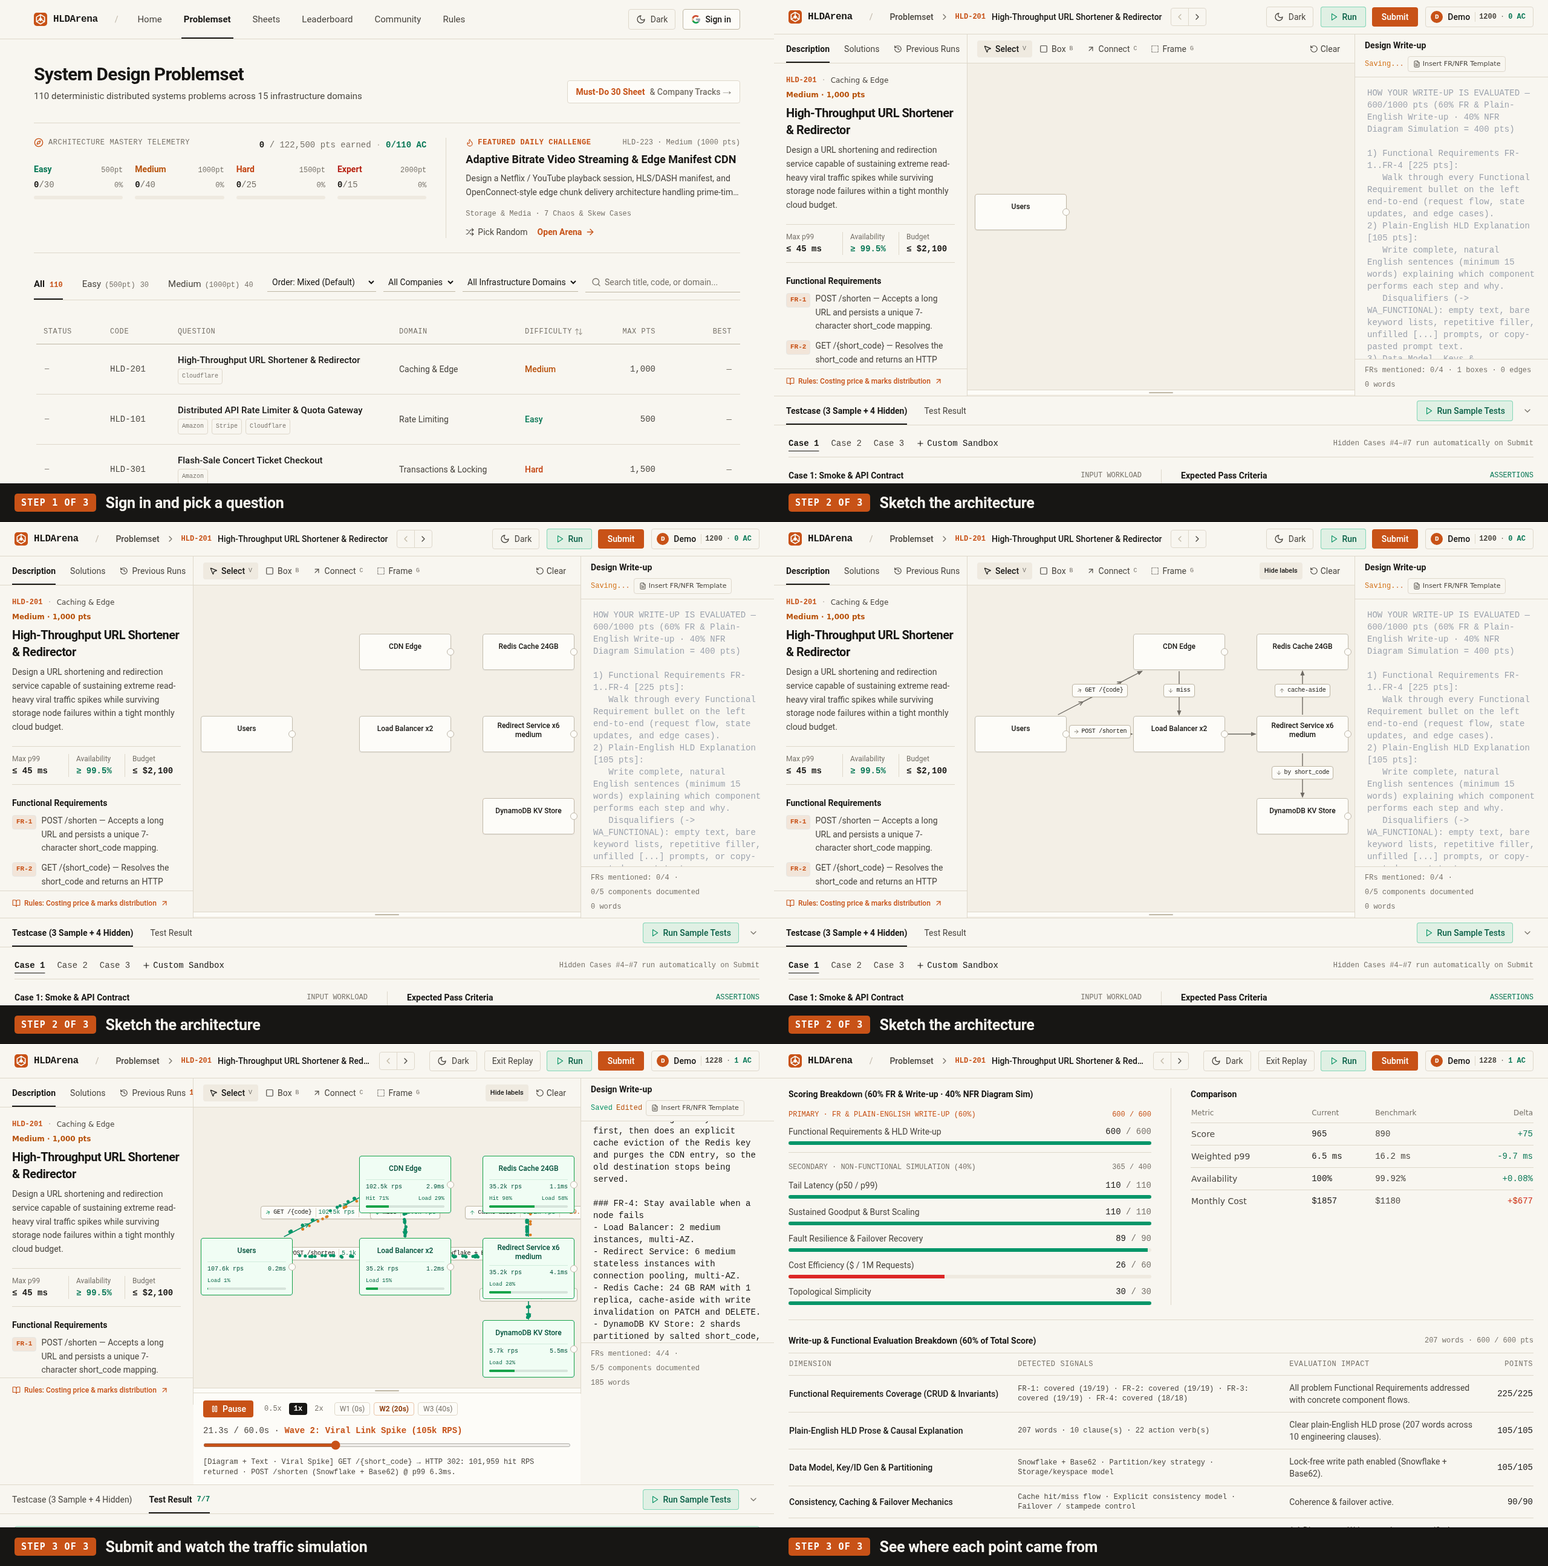
Start with beginner prompts or follow curated company sheets.
Draw components on the canvas and write simple design notes.
See latency, failovers, and cloud cost tested in seconds.
Try a Live Traffic Simulation
Toggle components directly or click through the 4 quick scenarios below.
Watch a single database slow down under heavy traffic
Every question gives you clear traffic, latency, and budget targets. Try sending 85,000 requests/sec into a single database shard to see latency spike past the 30 ms target.
How scoring works
How a submission is scored
- 1. Your diagram is simulated.
Boxes and arrows become a graph. 7 test cases push traffic through it, including hot-key spikes, crashed nodes and peak load, and check p99 latency, availability and monthly cost against the question's limits. 4 of the 7 are hidden.
- 2. Your write-up is checked by fixed rules.
You earn marks for explaining each functional requirement, your data keys, failure handling and every box you drew, in full sentences. Keyword lists, copied prompt text and unfilled templates fail.
- 3. Marks are 60% write-up, 40% simulation.
Accepted needs both: the write-up check and every limit in all 7 test cases.